
If you have a 7+ year horizon, lumpsum investing usually beats spreading it out: markets rise more often than they fall, so waiting typically costs returns.
Which decision are you actually making?
- Monthly income: SIP by definition. There is no existing lumpsum to compare against.
- Lumpsum, 7+ years, steady temperament: immediate deployment is the answer based on data.
- Lumpsum, but a large amount, scary-looking market or you are scared: a 3–6 month Systematic Transfer Plan (STP) is a behavioural tool and may not get better returns.
- Under 3 years: this is a capital-preservation and debt/short-term discussion; equity likely should not be involved.
Does lumpsum actually beat SIP?
For money already in hand, lumpsum wins more often than not. Of ₹10 lakh spread through a 12-month SIP, each instalment after the first remains outside equity until its scheduled investment date; across the year, the average amount waiting is roughly half the original corpus. In a rising market, that delay misses equity upside.
The downside is entering just before a steep drawdown: the whole amount takes the fall immediately, while staged buying would have averaged entry costs down. Lumpsum offers higher expected returns but a wider spread of entry-date outcomes. With enough time to withstand the worst-case window, the average is what matters.
But the market is at an all-time high—isn't that a warning?
In markets that compound over decades, all-time highs are not rare; they cluster. A high is an ordinary market condition, not a reliable signal of an approaching crash.
Between January 2015 and April 2026, 59% of NIFTY 50 trading days closed within 5% of their running all-time high. A high is an ordinary market condition, not a reliable signal of an approaching crash.
The correction may never arrive, or may start from a level 20% higher, leaving immediate entry better off. Waiting trades a certain opportunity cost—time outside the market—for an uncertain dip. Instead of guessing the unknowable top, ask whether your horizon can absorb a 30–40% drawdown. That answerable question should drive the decision.
How does an STP offer a middle path?
An STP moves fixed instalments between funds within the same fund house, typically into equity over 3–6 months. It is a SIP funded by your corpus rather than salary. Liquid and arbitrage funds are highly liquid, low-risk parking options:
Liquid funds: near-instant access, negligible volatility and a small graded exit load only in the first seven days.
Arbitrage funds: equity taxation because they hold 65%+ in hedged domestic equity. NAV can wobble with arbitrage spreads; some schemes have exit loads for the first 15–30 days.
The applicable tax treatment differs:
What the 100 random simulations show: One-go vs SIP
Median corpus
The median five-year corpus compares what a typical starting point produced under each approach.
Median corpus: lumpsum versus SIP
| Item | Corpus (₹ lakh) |
|---|---|
| Lumpsum | ₹19.84 lakh |
| SIP | ₹19.13 lakh |
Average absolute returns
Average absolute returns are measured against the ₹10 lakh total contribution across each 10-month programme.
Average absolute returns: lumpsum versus SIP
| Item | Absolute return (%) |
|---|---|
| Lumpsum | 94.76% |
| SIP | 90.24% |
Which approach won more often?
Simulation with higher final corpus (out of 100)
| Item | Number of simulations |
|---|---|
| Lumpsum higher | 65 simulations |
| SIP higher | 35 simulations |
Lumpsum deployment: One-go vs 10 SIPs
The timing advantage usually favoured investing sooner.
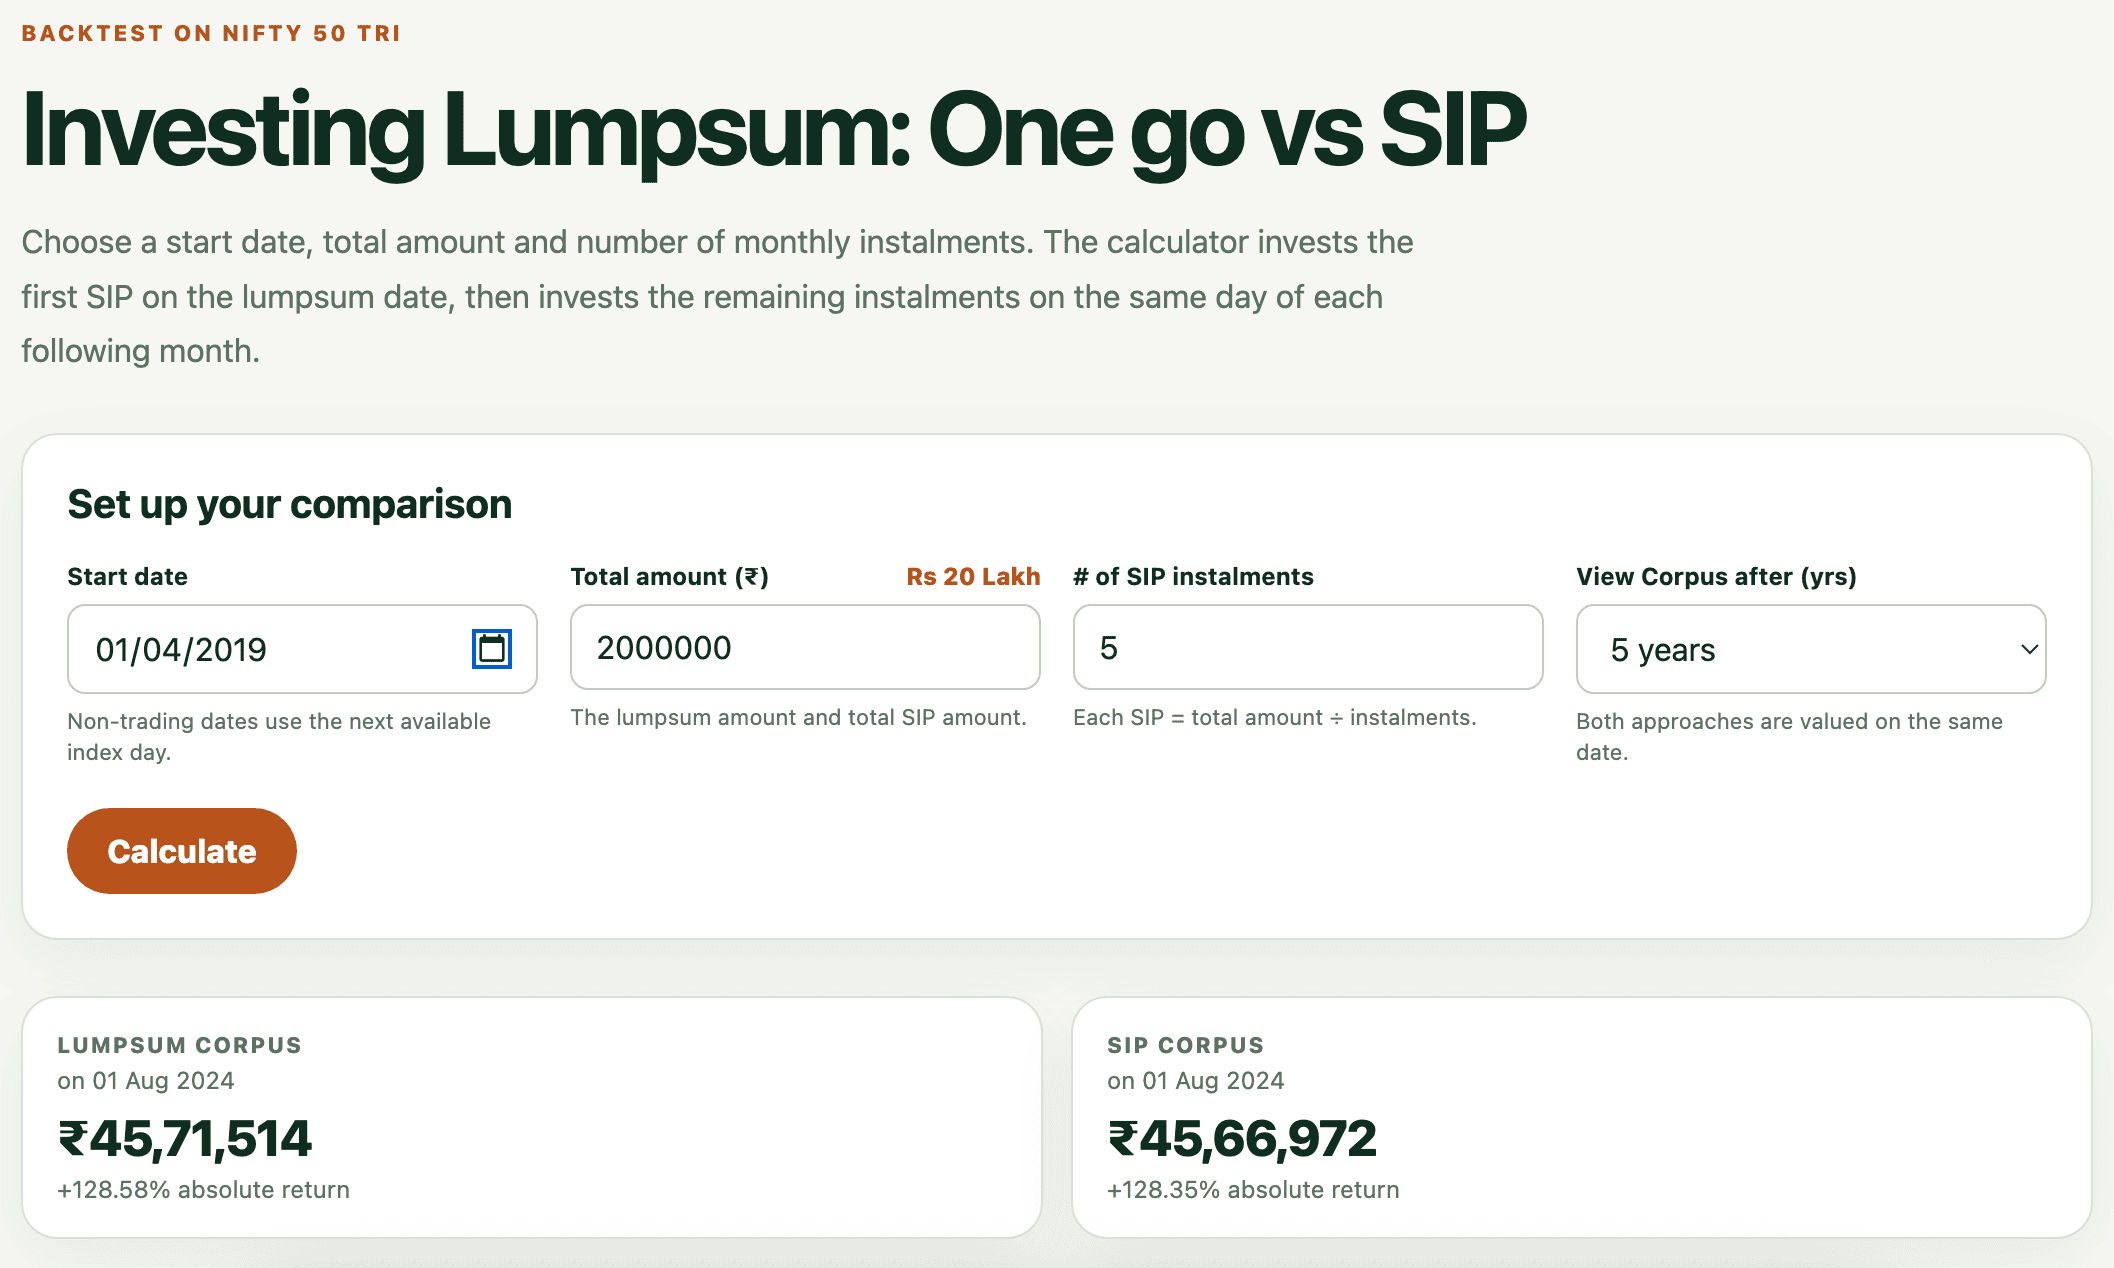
Want to test your own amount and start date? Use our interactive backtesting simulator to check returns of one-go versus SIP deployment.
For someone in the 30% slab, 20% short-term tax is meaningfully cheaper. With a high tax bracket and a 3–6 month runway, arbitrage usually wins after tax; for lower brackets or instant, zero-volatility access, liquid is the cleaner choice.
Worked example—illustrative: ₹18,00,000 from a matured FD sits in the arbitrage fund of the AMC whose equity flexicap fund is the target. An STP transfers ₹3,00,000 monthly for six months. Each transfer is a source-fund redemption and taxable event; gains on units held for weeks or months attract 20% short-term tax.
If the arbitrage fund earns roughly 6.5–7% p.a. while waiting, the earlier tranches have more time to accrue gains than the later ones, so tax varies by transfer and should be calculated from the actual gain on each redemption. Total tax drag is immaterial and need not derail a plan that protects your temperament.
An STP is not a return-enhancing hedge. On average, it underperforms immediate lumpsum investment because money waits in a lower-yielding fund. Its purpose is peace of mind and avoiding worse behavioural decisions.
Which approach fits your situation?
| Source | Horizon | Temperament | Reasoning |
|---|---|---|---|
| Recurring annual bonus | Any | Any | Income-like: lump or short SIP, rather than hoarding cash for a perfect entry. |
| One-time large bonus / ESOP liquidity | 7+ years | Steady | Immediate deployment fits; waiting in cash is costly. |
| Large, emotionally charged inheritance | 7+ years | Anxious | 3–6 month STP: the maths slightly favours lumpsum; regret strongly favours easing in. |
| Matured FD | 5–7 years | Steady | Horizon supports equity; lumpsum or 2–3 month STP if that secures commitment. |
| Matured FD / property windfall | Under 3 years | Any | Capital preservation; equity likely should not be involved. |
| Accumulated savings; market feels toppy | 7+ years | Would panic at a 20% fall | 3–6 month STP plus a written drop-response plan—ideally, no action. |
| Property sale / near-term goal money | Short | Any | Outside equity: liquid, arbitrage or short-duration debt for capital preservation. |
Your horizon decides whether equity fits; your temperament decides whether to enter at once or gradually.
What does the spreadsheet miss?
Investors waiting for a better level often anchor on a missed price. As markets rise, they keep waiting, eventually buying much higher or staying in cash for years. The cost is usually a historic rally missed rather than a crash successfully avoided.
- Automation: an STP removes the monthly reopening of the entry decision.
- Pre-commitment: a written horizon and response to a 20% mid-transfer fall settles the question before fear arrives. Continuing is almost always the right response.
- Adherence: an optimal lumpsum entry followed by panic-selling at the bottom is worse than a suboptimal STP held through the fall.
The best strategy on paper loses to a mediocre strategy you can actually stick with. Or talk to a flat-fee SEBI-registered RIA to help you manage your investments.
This article is for educational purposes only, not investment advice or a recommendation to buy or sell any security or fund. Consult a SEBI-registered investment adviser about your specific circumstances before acting.
Across 100 randomly selected trading-day starts in this period, the lumpsum finished ahead in 65 cases and the ten-month SIP finished ahead in 35. The table shows 10 randomly selected examples from the 100-run backtest; the five-year corpus and absolute return are calculated from the ₹10 lakh total contribution.
Five-year NIFTY 50 TRI outcome: 10 samples
| Item | 5-year corpus (absolute return) |
|---|---|
| 2015-10-05 | Lumpsum ₹15.08L (50.83%) · SIP ₹15.58L (55.78%) |
| 2016-02-16 | Lumpsum ₹23.16L (131.61%) · SIP ₹20.10L (101.04%) |
| 2016-03-22 | Lumpsum ₹20.35L (103.52%) · SIP ₹19.01L (90.12%) |
| 2017-03-24 | Lumpsum ₹20.11L (101.14%) · SIP ₹18.63L (86.28%) |
| 2017-08-02 | Lumpsum ₹18.31L (83.07%) · SIP ₹17.90L (78.95%) |
| 2017-10-26 | Lumpsum ₹18.17L (81.73%) · SIP ₹17.61L (76.14%) |
| 2018-09-17 | Lumpsum ₹18.83L (88.29%) · SIP ₹19.22L (92.18%) |
| 2019-03-25 | Lumpsum ₹20.63L (106.26%) · SIP ₹20.04L (100.45%) |
| 2019-05-21 | Lumpsum ₹20.43L (104.27%) · SIP ₹20.29L (102.93%) |
| 2019-07-16 | Lumpsum ₹22.40L (123.98%) · SIP ₹23.53L (135.25%) |
Questions from Ask Foliyo
Here are five real investor questions that come up when deciding how to deploy a lumpsum.
I have a large amount available and want to invest for the long term. Should I deploy it at once or spread the investment through SIP?
Read More »After a market correction, is this a better entry point for a lumpsum, or should I still phase the money in?
Read More »I have money earmarked for a 2–5 year goal. Should it go into equity as a lumpsum, SIP, or a safer option?
Read More »Markets are falling and I already have a SIP. Should I stop it and wait for conditions to improve?
Read More »How much can waiting or missing a few strong market days affect long-term investment outcomes?
Read More »